Graphics

Table of Contents

Introduction

Graphics can make web pages come alive. Online Scholar allows you to import graphics from many applications, and it has a built-in Text-to-Graphics capability using a wide variety of plugins to make graphs, images, charts, diagrams, etc.

The data for the plugins (such as PlantUML, Mermaid and others) are stored in Online Scholar, so you can easily find and update the data later when required.
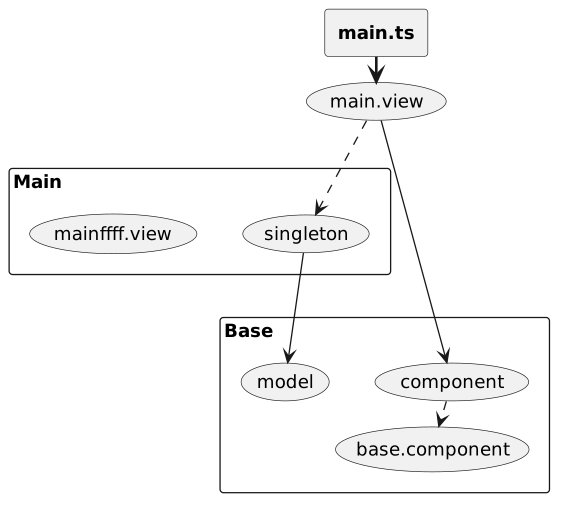
Sample chart

sample chart

And the next line following the chart.

How to Make the image

Use Manage Assets then New Plugin File.

Add the following code

skinparam ranksep 20
skinparam dpi 125
<style>
  rectangle {
    HorizontalAlignment: left;
  }
</style>

rectangle "Main" {
  (mainffff.view)
  (singleton)
}
rectangle "Base" {
  (base.component)
  (component)
  (model)
}
rectangle "<b>main.ts</b>" as main_ts

(component) ..> (base.component)
main_ts ==> (main.view)
(main.view) --> (component)
(main.view) ...> (singleton)
(singleton) ---> (model)

Set the Model to: PlantUML

Press Generate to generate the image.

Set the filename to sample and press save to save both your source code and the resulting SVG file.. Then close the model editor to return to your document.

Place the following in your document

Here is a sample chart:

image:sample.svg[sample chart]

And the next line.

Other Examples

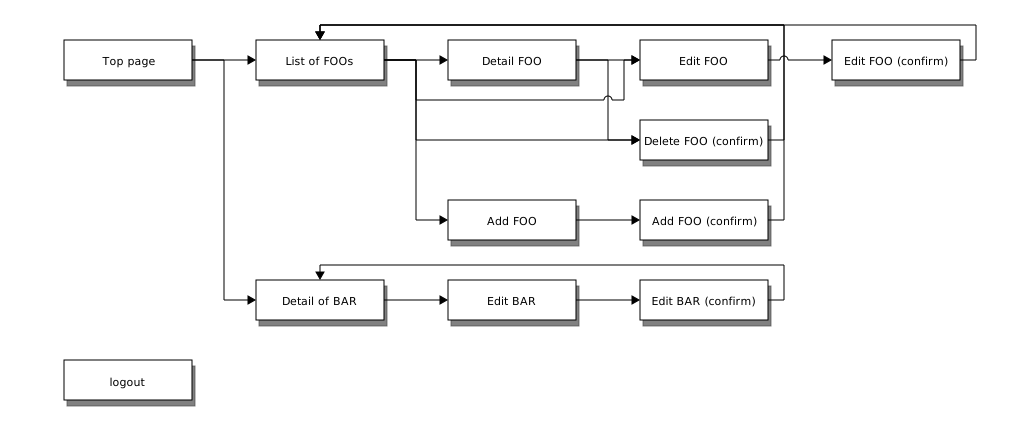
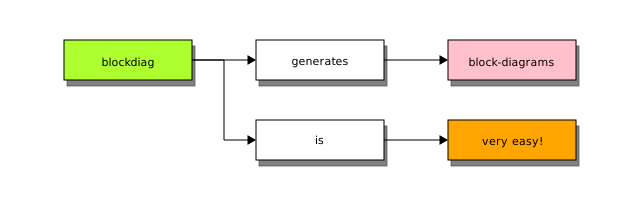
Block Diagram

block diagram


Block Diagram - Avanced

block diagram - advanced


WordCloud

word cloud


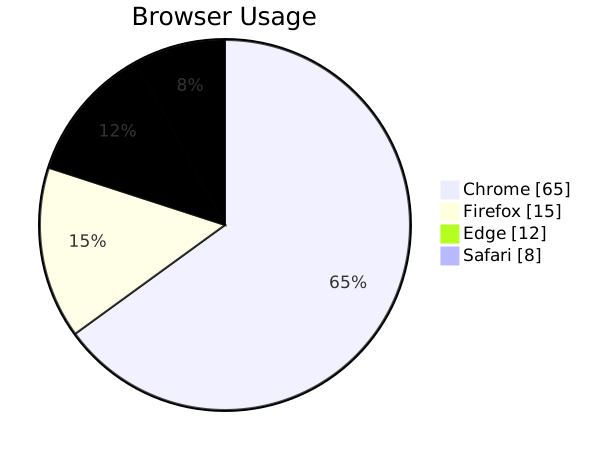
Pie Chart

pie chart And we put some text to the side.


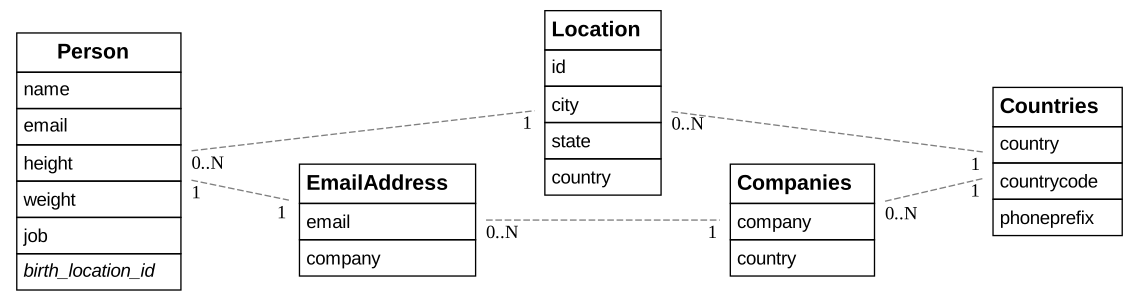
Entity Relationship Diagram

erd


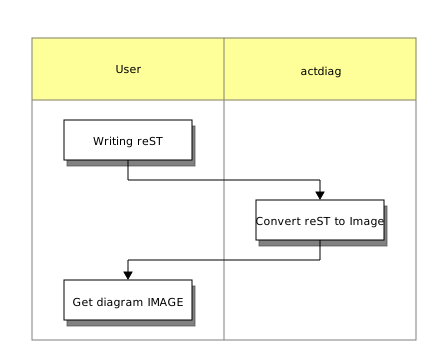
ACTDIAG

actdiag


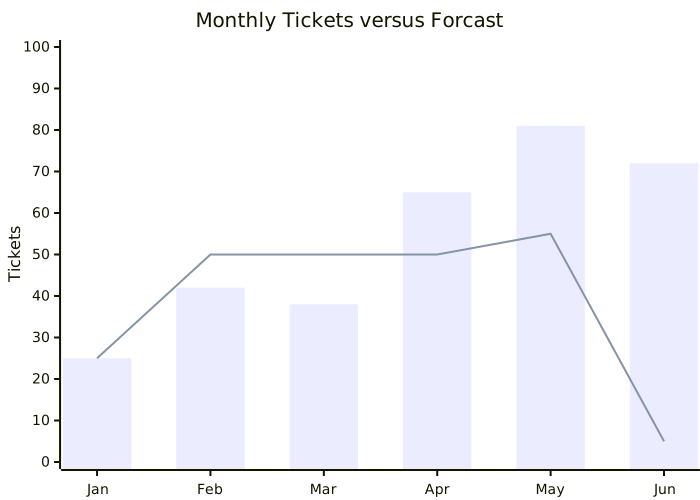
Bar or Line Charts

bar-line-chart


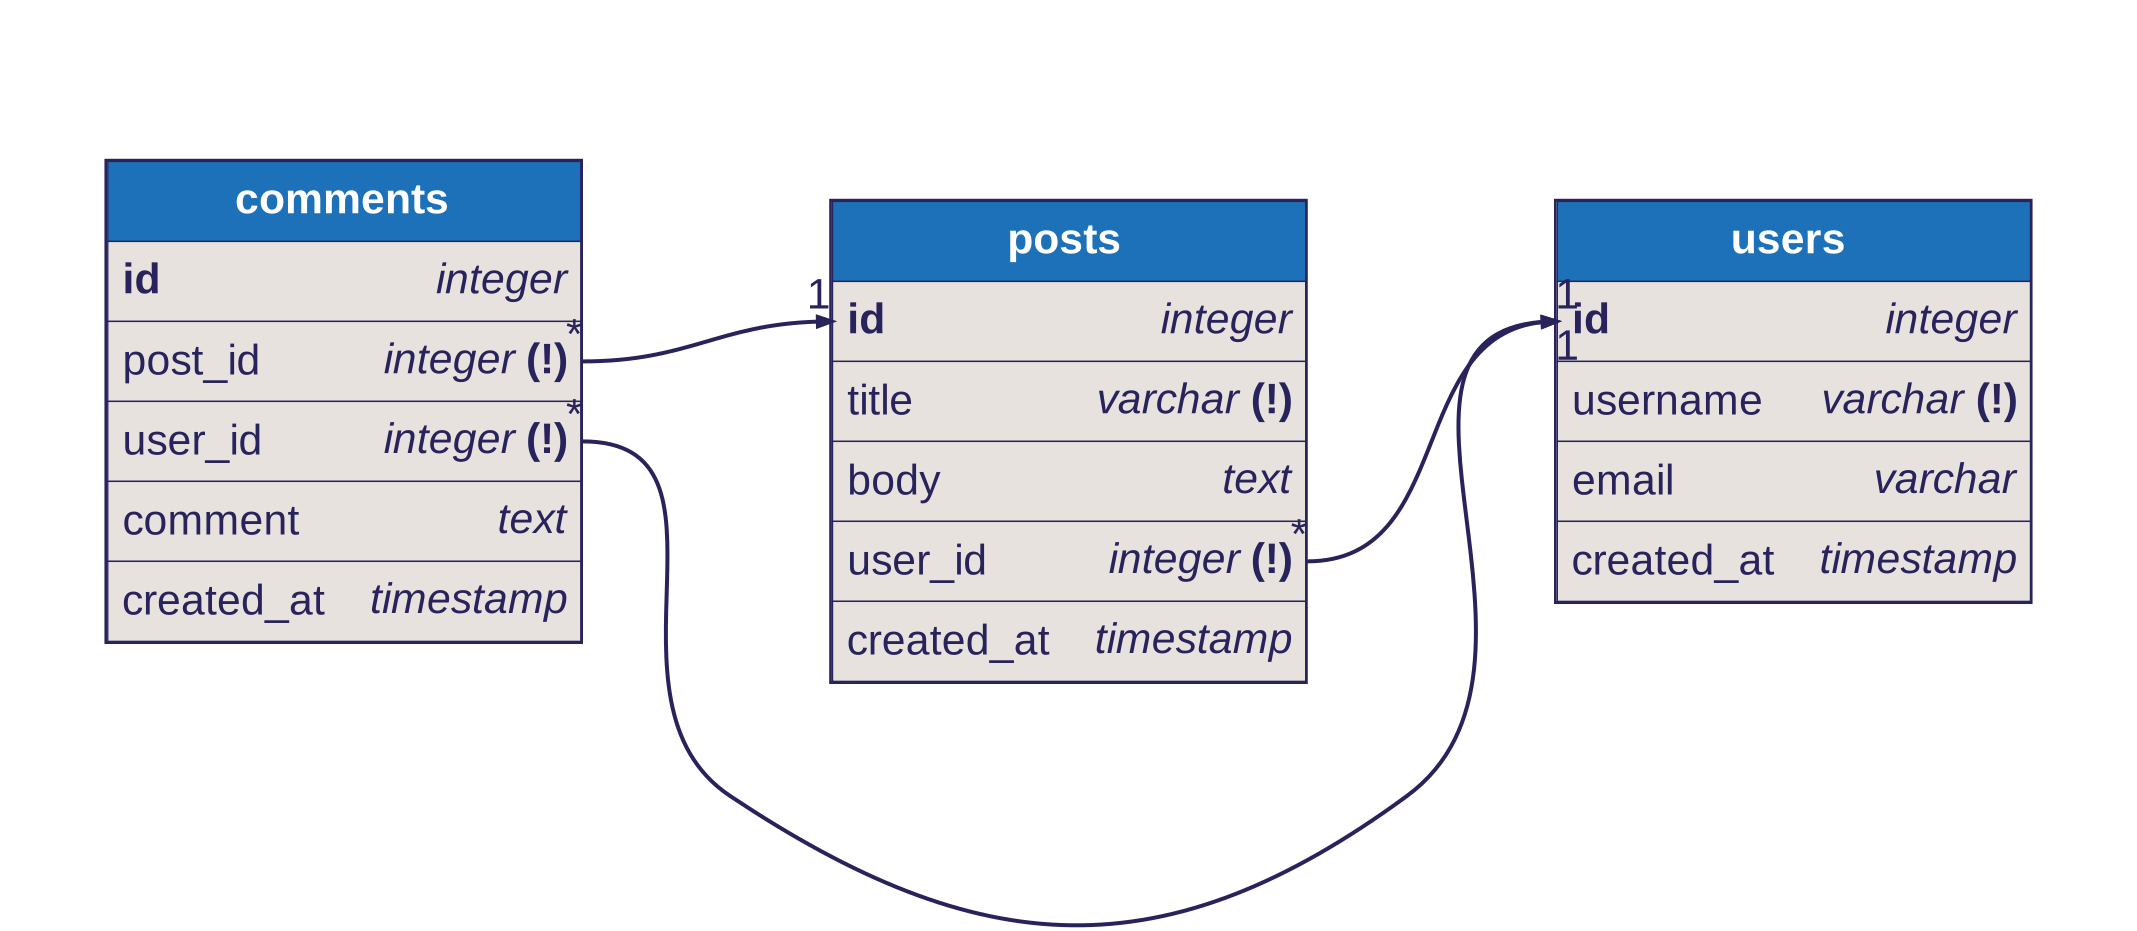
DBML Entity Relationship Diagram

dbml


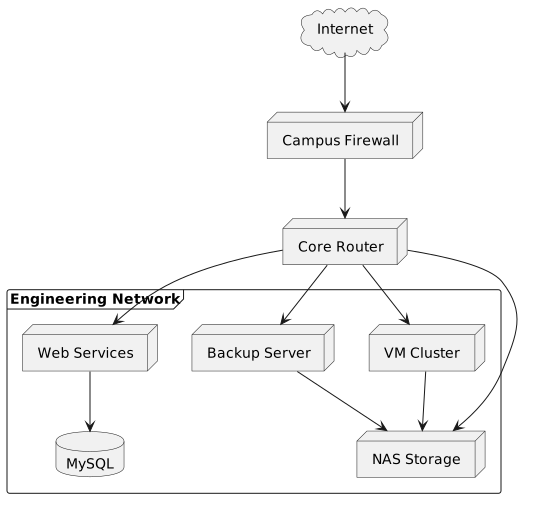
Network Structure

network